Dashboard
Your home base for seeing what's happening across your accounts.
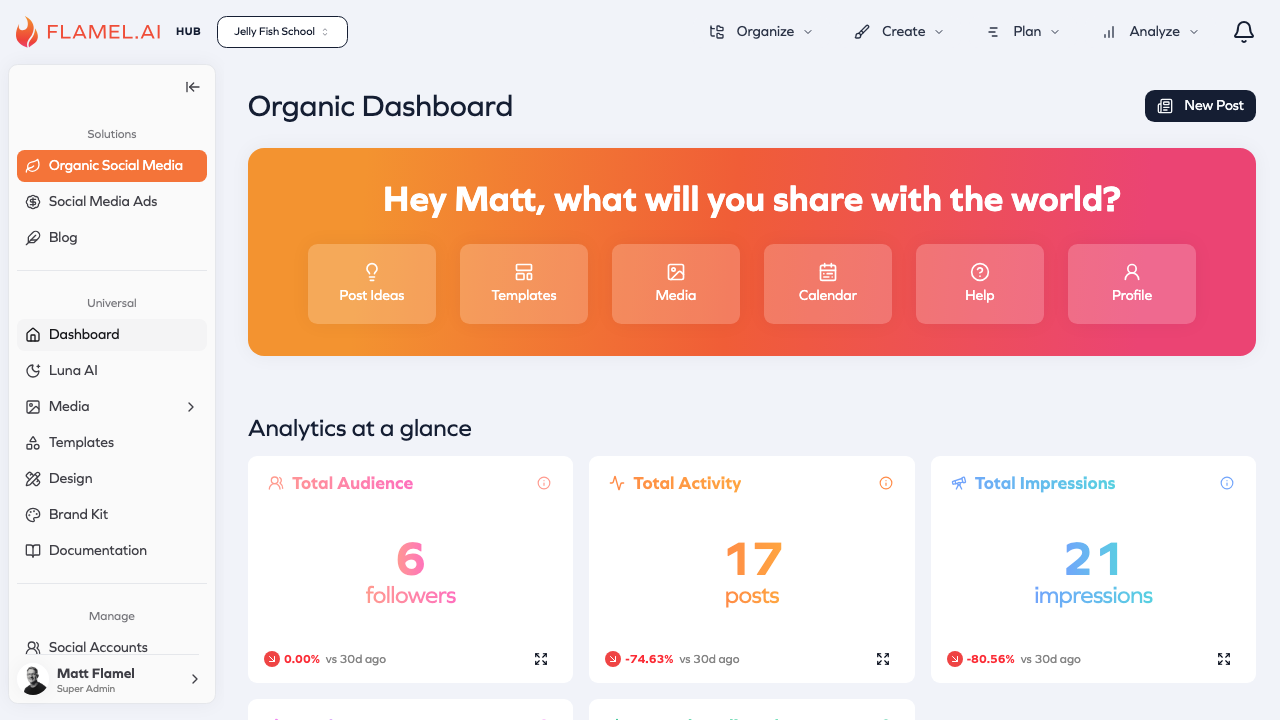
When you log into Flamel, the Dashboard is the first thing you see. It gives you a quick snapshot of what's happening across all your connected accounts — recent performance, upcoming posts, and anything that needs your attention.
What the Dashboard Shows
The Dashboard surfaces the most important information so you can quickly understand the state of your social presence.
Recent performance appears at the top, showing how your posts have been doing over the past week. You'll see engagement trends and which content resonated with your audience.
Upcoming content lists posts that are scheduled to go out soon. This helps you stay on top of what's publishing and catch any last-minute issues.
Alerts and notifications highlight things that need action — a social connection that's about to expire, posts waiting for approval, or anything that failed to publish. These are designed to be actionable: click on an alert and you'll go directly to where you can fix the issue.
Connection Health
One of the most important things the Dashboard monitors is the health of your social connections. Social platforms require periodic re-authentication, and if a connection expires, your scheduled posts won't publish.
The Dashboard uses color-coded indicators to show connection status:
| Status | Meaning |
|---|---|
| Green | Connected and working normally |
| Yellow | Connection expiring soon — reconnect within the next few days |
| Red | Disconnected — needs immediate reconnection |
When you see yellow or red, click on the connection to re-authenticate. It only takes a moment and prevents missed posts.
Quick Actions
The Dashboard includes shortcuts to common tasks. Instead of navigating through menus, you can quickly jump to creating a new post, viewing your calendar, or checking your notifications — all from the home screen.
Module-Specific Views
Each major module in Flamel has its own dashboard with metrics specific to that area:
Organic Social shows post performance, engagement rates, and audience growth trends.
Paid Social Ads displays campaign spend, conversion metrics, and return on ad spend (ROAS).
Email Marketing presents campaign performance, subscriber growth, and open/click rates.
Blog tracks page views, engagement, and your most popular content.
You can access these by navigating into each module, but the main Dashboard gives you a combined view across everything.
Making the Dashboard Work for You
The Dashboard is designed to be your daily starting point. Spend a minute each morning checking it to:
- Make sure all connections are healthy
- Review what's publishing that day
- Address any alerts before they become problems
- See how yesterday's content performed
This quick daily check helps you stay on top of your social presence without getting lost in the details.