Total Engagement
Track interactions and engagement metrics across your social content.
Monitor total engagement and interaction trends across all connected accounts.
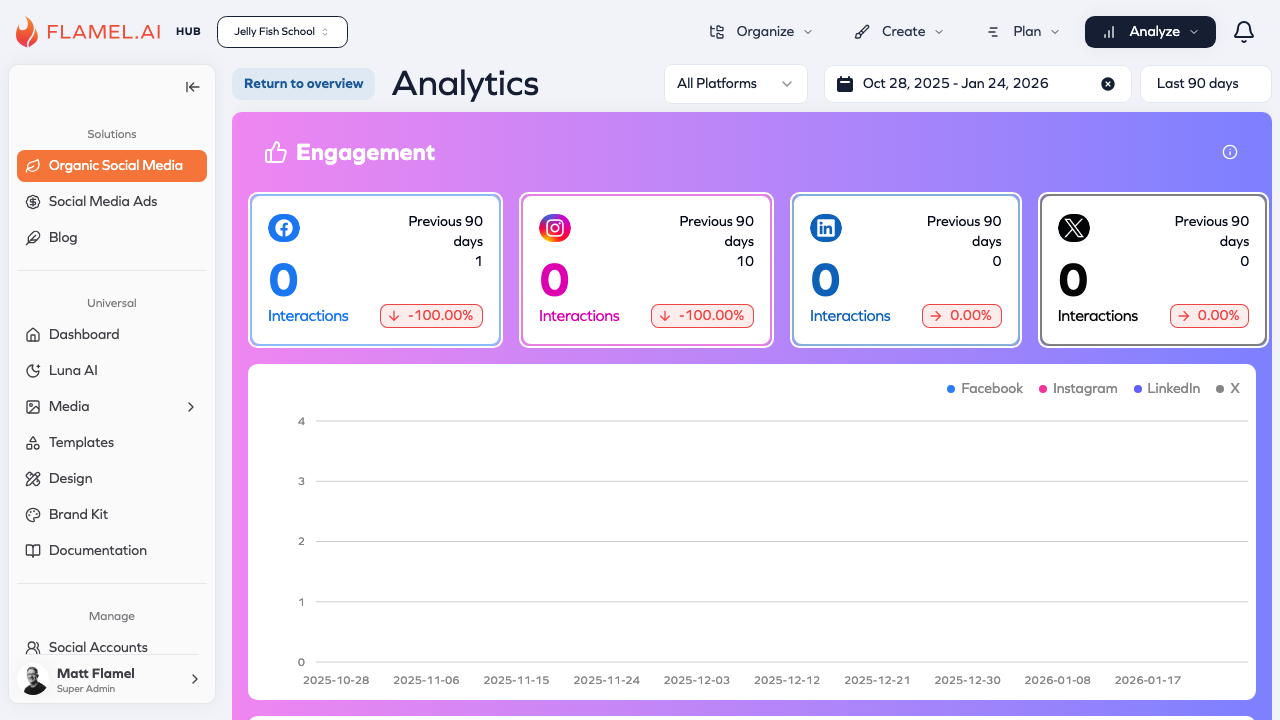
Platform Breakdown
View interaction counts for each connected platform:
| Platform | Engagement Types |
|---|---|
| Likes, comments, shares, clicks | |
| Likes, comments, saves, shares | |
| Reactions, comments, shares, clicks | |
| X (Twitter) | Likes, retweets, replies, quotes |
Understanding Engagement
Engagement measures how audiences interact with your content:
- Passive engagement includes likes and reactions
- Active engagement includes comments, shares, and saves
- Engagement rate normalizes interactions against reach or followers
Trend Analysis
The time series chart helps identify:
- High-performing content that drove engagement spikes
- Audience activity patterns across days and weeks
- Platform preferences for where your audience engages most
Accessing This View
Click the expand icon on the Total Engagement card from the Analytics Overview page to access this detailed view.